

The Power of Zero: How Indexed Life and Annuity Policies Protect Your Investment
Diversification and lower risk investments play a critical role in a sound retirement plan. Choosing a lower risk account for a portion of your retirement funds provides a level of security to your retirement income – a foundation to build your dreams on.
How Does Diversification Protect Investors?
A basic principle of investing is diversification - spreading your money over a range of different types of investments so that a single catastrophic event is less likely to drain all your hard-won savings. How you diversify depends on a number of factors starting with your comfort with risk and how soon you need to withdraw from your investments. Most people look towards lower risk investments as they get closer to retirement. Some common choices are life insurance, annuities, dividend-paying stocks, bonds, bank Certificates of Deposit (CDs), real estate, and savings accounts. Of all of these choices, only fixed index life insurance and annuities can deliver growth based on rises in stock market while shielding you from losses.
Average Rate of Return Versus Actual Rate of Return – What Does It Tell You About Retirement Investments?
The key to this lower risk strategy is “Zero Market Loss”. To understand how this strategy works, it’s important to understand the difference between “Average Rate of Return” and “Actual Rate of Return” as it applies to investing in the stock market. Average Rate of Return is the number most often quoted when an investment advisor is explaining why buying stocks is a reliable long term choice for growth of your money. It is a helpful tool for quickly comparing stock investment options, but what does it really mean?
Let’s say the Standard & Poor’s 500 Index (S&P 500) gained 10% 2 years ago. But last year it lost 10%. If you average the 2 years together, it appears that if you had invested in the exact stocks that make up the S&P 500 Index, your investment would have simply stayed the same over the last 2 years.

Not the growth the investor hoped for, but at least they didn’t lose anything. But is that true? Time to figure out the Actual Rate of Return. Let’s say Joe invested $100,000 in an S&P 500 mutual fund which mimics the equities that make up the S&P 500 index.
1st Year 10% Gain. 10% of $100,000 equals $10,000 Actual Rate of Return. $100,000 investment + $10,000 gain = $110,000 new account value. Nice!
2nd Year 10% Loss. 10% of $110,000, the new account value, equals $11,000 Actual Rate of Return. Since it was a loss, subtract the $11,000 from Joe’s 2nd year account value of $110,000. $110,000 account value - $11,000 loss = $99,000 remaining in the account.
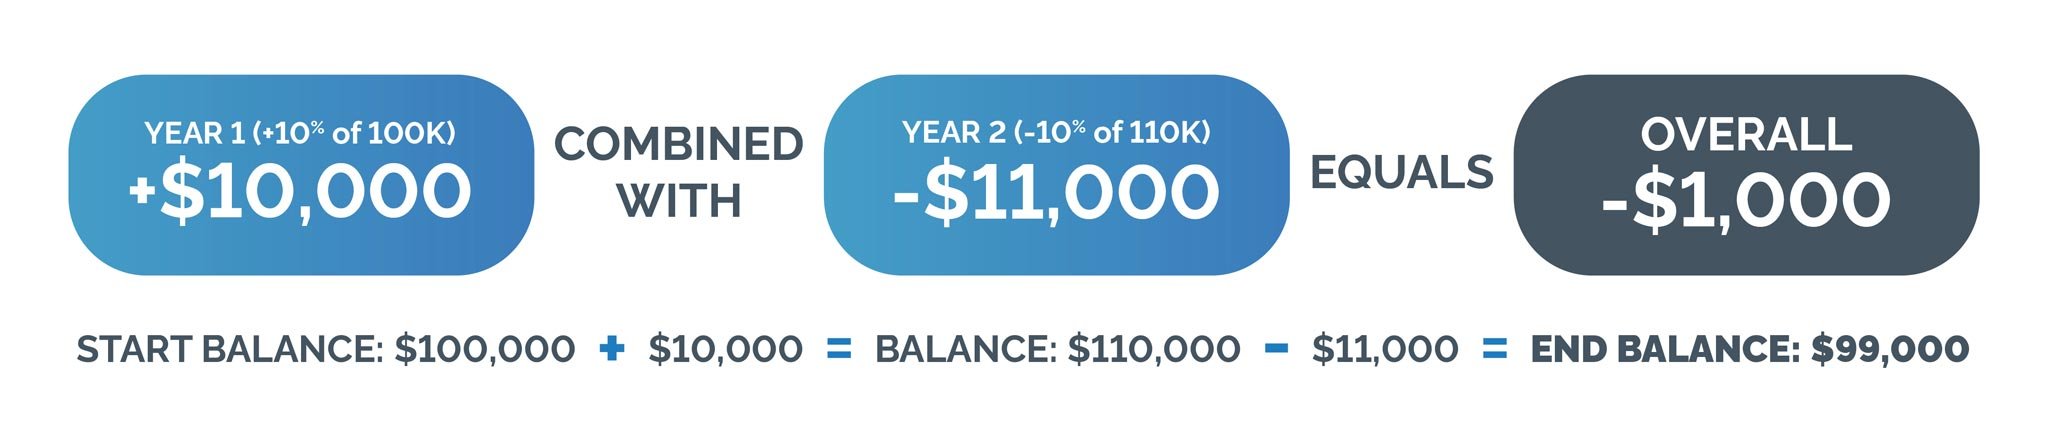
Over 2 years with an Average Rate of Return of 0%, Joe’s Actual Rate of Return was a loss of $1,000 or 1% of his investment. The plain mathematical fact is that every time the market goes down, the Actual Rate of Return will provide a more accurate picture of what’s happened to money invested in the stock market, not the Average Rate of Return.
Now imagine Joe has retired and is taking annual income payments from his stock investment account. Generally speaking, financial experts recommend withdrawing between 4% and 6% of the original investment account value to provide a lifetime of income. The idea being that market growth will make up for the withdrawal, maintaining the original account value.
Joe wants to make sure his money lasts for the rest of his life so he opts for a more conservative 4% annual withdrawal. 4% of Joe’s initial investment of $100,000 equals $4000 income withdrawal each year.
Now let’s look at the Actual Rate of Return for the same 2 years showing an Average Rate of Return of 0% ( 1st year a 10% gain followed in the 2nd year by 10% loss).
1st year 10% Gain. 10% of $100,000 equals $10,000 Actual Rate of Return. $100,000 investment + $10,000 gain = $110,000 new account value. Income withdrawal of $4,000 $110,000 account value - $4,000 income withdrawal = $106,000 remaining in account.

2nd year 10% Loss. 10% of $106,000, the new account value, equals $10,600 Actual Rate of Return. $106,000 remaining account value - $10,600 loss = $95,400 new account value. Income withdrawal of $4,000 $95,400 account value - $4,000 income withdrawal = $91,400 remaining in account.

After just one year of loss at 10%, Joe needs a 13.8% Average Rate of Return in the 3rd year to recover.
3rd Year 13.8% Gain Needed. $100,000 initial investment + $4,000 income withdrawal = $104,000 needed to get back to his original $100,000 account value. $104,000 needed - $91,400 in account = $12,600 increase needed. $12,600 increase / $91,400 account value = 13.8% gain needed in 3rd year.

Even being conservative with his withdrawals, one down year in the stock market has already taken a big bite out of Joe’s retirement account. Several years in a row of loss would devastate his account and make it very difficult to recover during years of stock market growth.
What If You Didn’t Have to Worry About Market Loss?
A big drawback of most lower risk accounts is that you lose the opportunity for your money to grow when the stock market grows. And the stock market still beats most options for long term growth – as long as you have time to recover from a few years of market loss. That’s where fixed index permanent life insurance and annuities come in.
Fixed indexed policies offer interest credits based on the growth of selected funds. But when the markets go down, no loss is taken. Your account credit is actually $0.
Of course there is a cost for safety. In exchange for protecting against market loss, the fixed indexed policies limit how much of the market growth is used to calculate your interest credit. Each fund in each group of funds offered by each policies has different rules and limits but let’s keep it simple. A middle of the road example would be an S&P 500 Index fund with a 7% cap.
Let’s see how that works in Joe’s case.
1st Year 10% Gain. 10% gain is limited to 7% interest credit. 7% of $100,000 equals $7,000 interest credit. $100,000 investment + $7,000 interest credit = $107,000 new account value. Still a nice result.
2nd Year 10% Loss. 10% loss is calculated at 0%. Joe’s 2nd year account value does not change. Joe’s account can build on the $107,000 still remaining in the account.

Joe can build on his previous year’s gains without having to make up for the loss.
When Joe withdraws an annual income from his account here’s how it looks.
1st year 10% Gain. 10% gain is limited to 7% interest credit. 7% of $100,000 equals $7,000 interest credit. $100,000 investment + $7,000 interest credit = $107,000 new account value. Income withdrawal of $4,000 $107,000 account value - $4,000 income withdrawal = $103,000 remaining in account.
2nd year 10% Loss. 10% loss is calculated at 0%. Joe’s 2nd year account value does not change. $103,000 remaining account value. Income withdrawal of $4,000 $103,000 account value - $4,000 income withdrawal = $99,000 remaining in account.

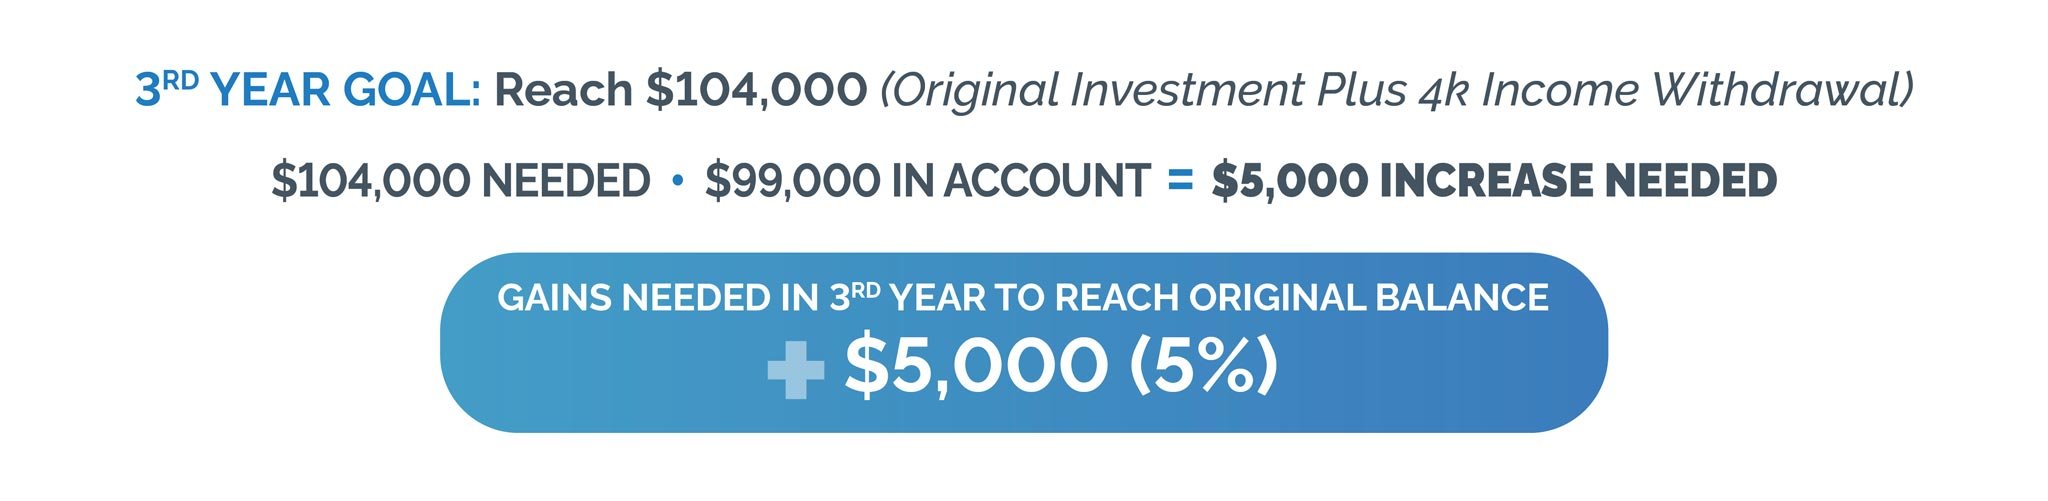
Joe’s account value of $99,000 in the fixed indexed account means a small growth in the 3rd year will bring his account back to solid ground.
3rd Year 5% Gain Needed. $100,000 initial investment + $4,000 income withdrawal = $104,000 needed to get back to his original $100,000 account value. $104,000 needed - $99,000 in account = $5,000 increase needed. $5,000 increase / $99,000 account value = 5% gain needed in 3rd year.
No one knows whether the stock market be booming or crashing when it’s time to retire. Doesn’t it make sense to add some protection your retirement savings?
Next Steps:
Of course, all the examples above are simplified for clarity. Investing in stocks rarely means matching or beating the S&P 500 Index even when investing in S&P 500 based mutual funds. Fees, dividends, inflation and taxes all affect actual results.
Life insurance and annuity policies offer a wide range of annual income options, all of which change the calculations. Fees, inflation, taxes, surrender charges and terms governing withdrawals affect actual results. For example, growth-focused funds can offer higher growth potential. Annuitizing an annuity can mean lifetime income regardless of future account value. Loan withdrawals on life insurance can offer tax-free income.
For real life comparisons of fixed index policies and guidance on how to choose a plan to provide a foundation to your retirement strategy, schedule a time with one of our experts.
For more information on strategies that can protect your retirement income, subscribe to our newsletter.